Tag Archives for " R "

4 automated report presentation using r latex beamer how to

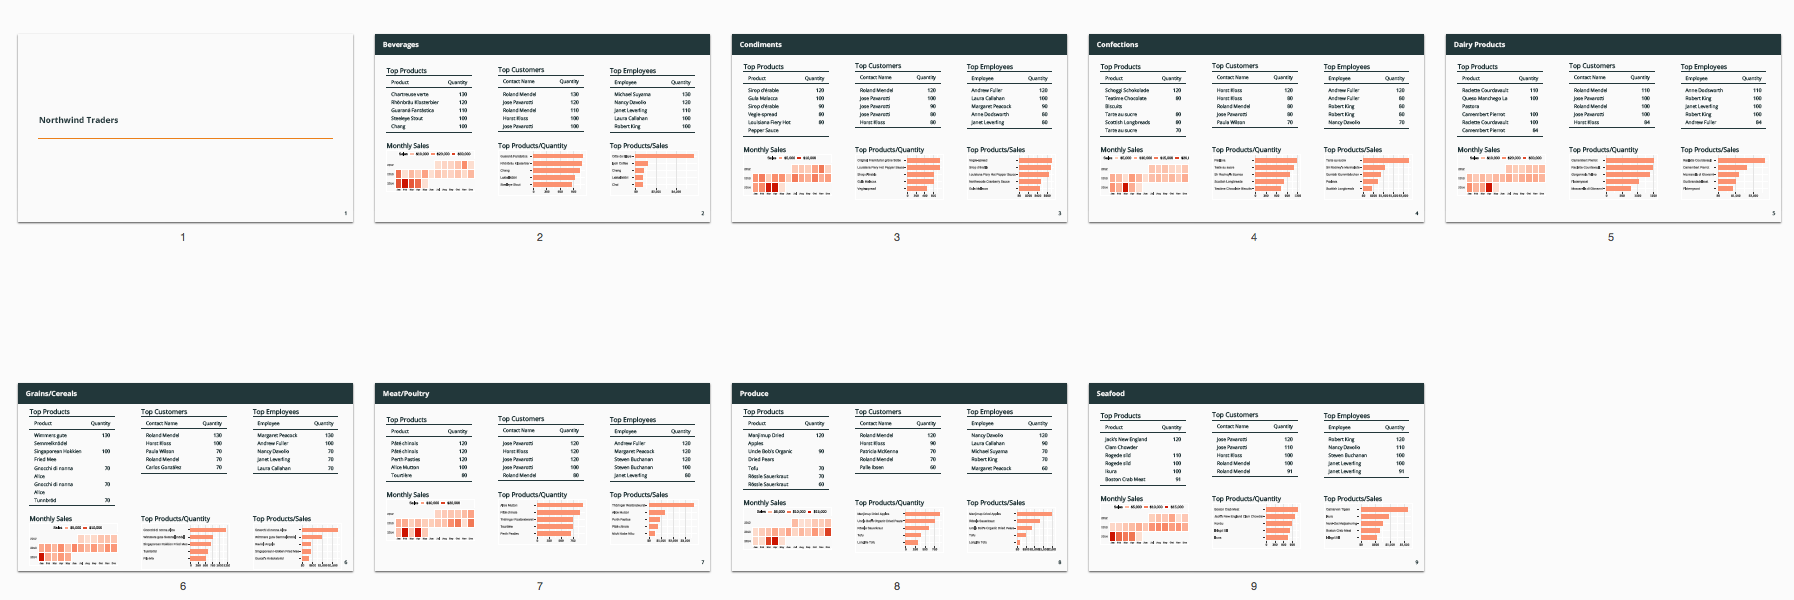
Automated Reports and Dashboards in R

Have you wondered how to create automated reports and dashboards in R?  Are there certain dashboards, reports, and presentations that show the same analysis for different categories or regions?Every time the data changes do you have to recalculate the numbers, recreate the charts, and design the slides? Did you wish for an automated statistical reporting system? Look […]

Continue reading
3 deep learning pytorch transformers Language Generation r python

Natural Language Generation with R (sort of)

Introduction “Loyal employees are your best brand ambassadors.” This is the kind of message that gets re-posted and re-shared on LinkedIn. The only exception in this case: a computer program generated this quote. I got tired of seeing the superficial posts on LinkedIn, so I thought I would experiment with natural language generation to create my […]

Continue reading
1 how-create-automated-reports-analysis-r

How to Create Automated Analysis Using R?

Have you found yourself repeating the same analysis for different groups in your data? And have you wondered about a better way of doing so in R? I have this problem often. RMarkdown, knitr, and RStudio make generating such automated reports very easy. You need two things: A parent file for data prep, loading libraries […]

Continue reading
2 pie-chart-waffle-chart-square-area-chart-dot-chart-rstats

A man went to buy waffles. He got pies instead. A Study of Waffle Chart vs. Dot Plot vs. Pie Charts

Parts-to-Whole Charts Creating good charts is difficult. Parts-to-whole charts are even more difficult to create, not technically, but to generate a higher level of efficacy. The most common parts-to-whole chart, in which you show different proportions of a measure, is a pie chart. So much so that a hotel advertised its meeting rooms with this […]

Continue reading
>