
Generating random numbers from the exponential distribution in Excel should not be such a difficult task, but the lack of a direct function does it make it difficult. In this post, you will see the steps to generate random numbers from the exponential distribution in Excel.
Understanding Exponential Distribution
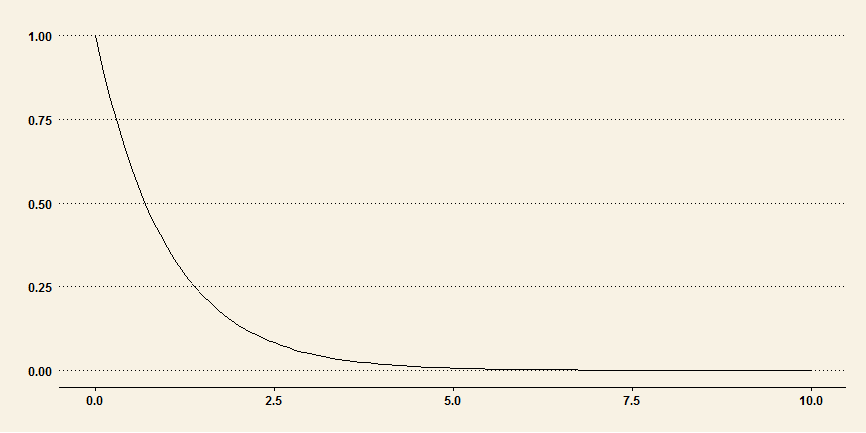
The probably density function (PDF) of exponential distribution is:f(x; lambda) = lambda * exp(-lambda * x)
where:
x is greater than or equal to zero
lambda is the rate parameter or 1/mean.
The cumulative distribution function (CDF) of exponential distribution is:
F(x; lambda) = 1 - exp(-lambda * x)
Percent Point Function (PPF) or Inverse of the cumulative distribution function, given by:
G(x) = - 1/lambda * logn(1- x)
We will use the PPF to generate exponential distribution random numbers.
Step 1: Generate Random Numbers from Uniform Distribution
- The first step is to create a set of uniform random numbers between 0 and 1. To generate these random numbers, simple enter this following command in your Excel sheet cell A2:
=RAND()
- Copy the formula down to A21, so that we have 20 random numbers from A2:A21.
Step 2: Calculate Mean of the Random Numbers
In a blank cell, say A22, calculate the mean of the numbers. Enter this formula:
=AVERAGE(A2:A21)
Step 2: Generate Random Numbers from Exponential Distribution
- In cell B2, enter this formula (there is a minus sign in front of A22):
=-A22 * LN(1 - A2)
where:
LN is the natural logarithm value.
- In the formula, make A22 absolute value by place the $ sign in front of the letter and numbers, such as $A$22.
- Drag the formula down to B21
See this following image for an example:

There you have it: you have successfully generated random numbers in Excel from the exponential distribution.
Excel And Statistics Books You May Be Interested In:
No products found.
Last update on 2022-05-05 / Affiliate links / Images from Amazon Product Advertising API
Very clear explanation. If I wanted the exponential distribution to have a different mean to that of that generated by the Rand() I could use the normal distribution random number generator in Excel and select say a mean of 5 but I would be forced to insert a standard deviation which I would choose say a 4 (99.999% of the area under the curve). However the results would include negative numbers which are unacceptable in a skewed distribution, particularly when time is involved. Can you advise?
This could be improved a little bit by specifying a cell to type in a lambda (or 1/lambda) rather than calculating a mean from the collection of uniform random draws (which will generally be around 0.5). This would also allow the user to make a single draw from RAND() to get a single draw from the exponential with the given lambda.